Submitted by Aakash Patel, a resident of central Greenwich and candidate for District 1 RTM
 We’ve all read countless articles about the RTM in recent months – and while so clearly impactful to our local community, it’s a uniquely complex body and difficult to track. To aid voters in making sense of it all, I helped create 203 Vote (https://203.vote/), a platform to track RTM voting statistics.
We went into this project with the goal of answering questions like:
- How non-partisan is our RTM in reality?
- As an informed voter, how can I quickly determine which RTM members tend to vote in my best interest? And which don’t?
- Are my elected RTM members following through with their commitment to represent my community?
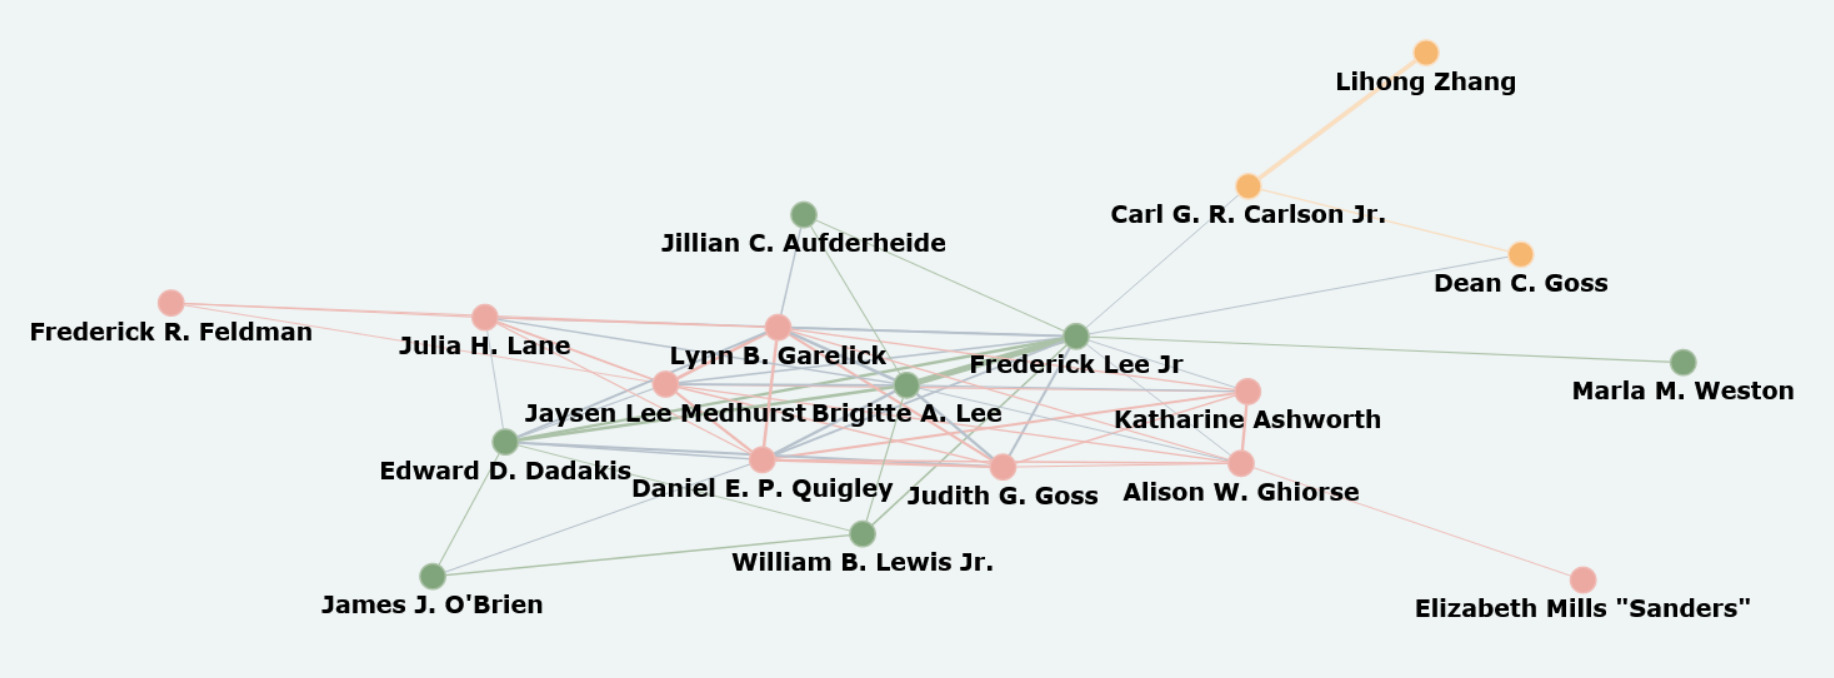
On the first item: when discussing the RTM, many use the phrase “non-partisan” in the ideological sense rather than the political sense (meaning the local town parties aren’t nominating candidates). This distinction is important to highlight, and the chart shown here is meant to do just that (https://203.vote/members). All members would ideally vote – regardless of their personal political affiliation – in a way that best serves the community. Though when looking at the data, it’s clear there is a “partisan” group of RTM members who consistently vote within party lines, and another more diverse “bi-partisan” group voting across party lines.

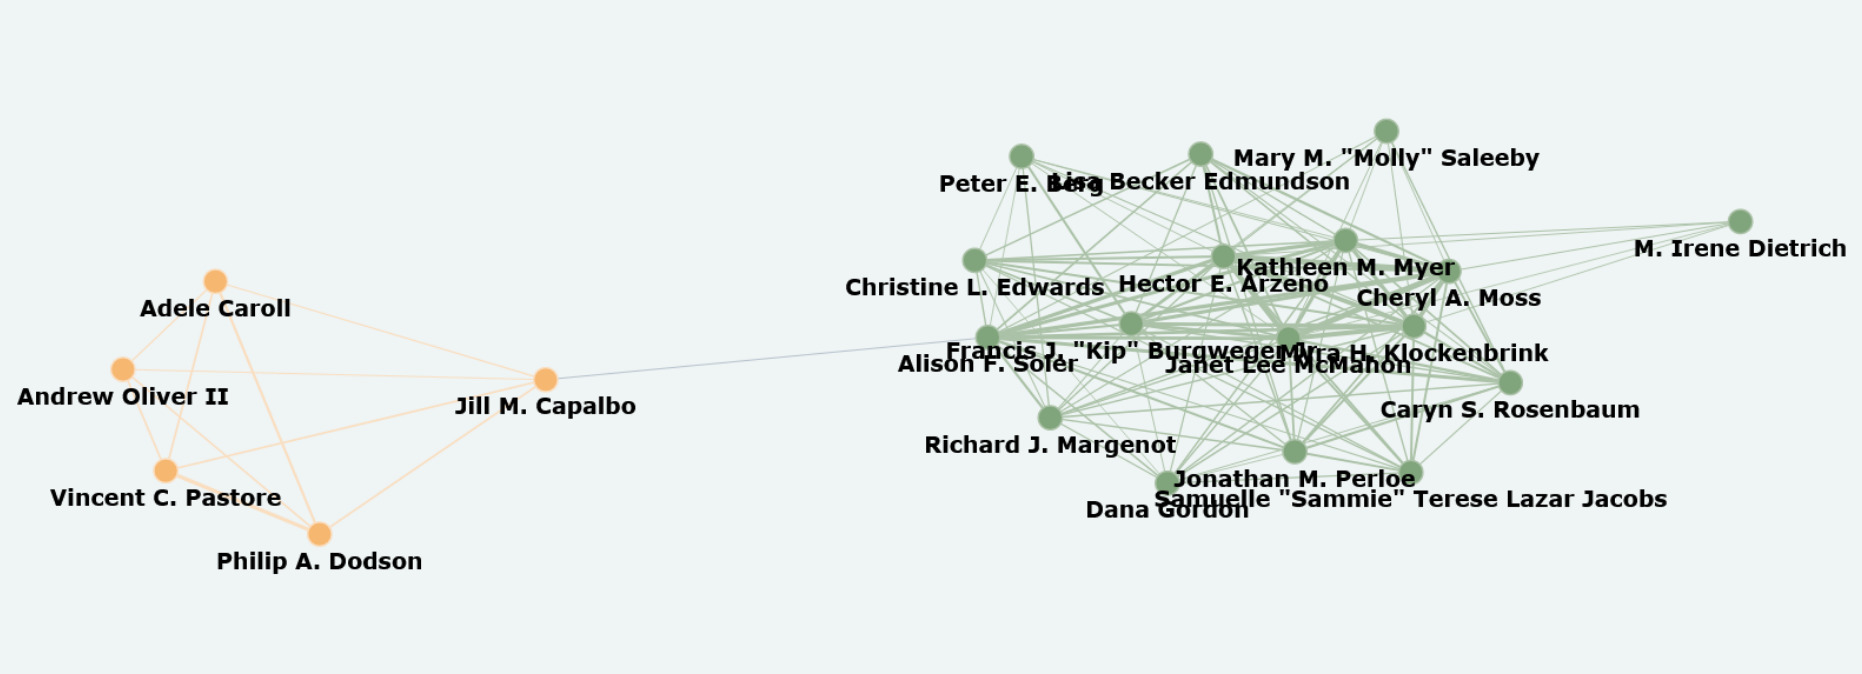
On the second item: we created pages for each district that quickly highlights groups of members who tend to vote in a similar manner – with the goal of helping voters quickly see who they might align with. As an example, take any of the hot-button issues voted on by the RTM (shown here: https://203.vote/measures). Pick a member in your district who voted in a way you agree with – or someone you already know. On the page for your district (https://203.vote/districts), quickly find others who may share a similar voting philosophy as that member. In District 1 – where I live – we can see a few different groups, indicating many members tend to vote in a diverse manner.
The same is not true of other districts. Take District 8 in contrast, where two clear groups emerge:
On the last item: in addition to showing their voting tendencies, we show participation rates for members on their individual pages – based on how often each member is eligible to vote.
There are multiple members who simply do not vote on a large portion of issues. Choosing to abstain when there’s a conflict of interest, or when you don’t feel informed, is perfectly acceptable – so voting yes or no 100% of the time is not the goal. That perfect attendance certificate in kindergarten wasn’t worth it if you gave all the other kids chicken pox.
That said, we found 11 members who have abstained on at least one out of every four votes (25%+) this term – even excluding absentees and the RTM moderator. Eight of those members are re-running for the upcoming term. I’ll leave it as an exercise for the reader to determine who they are, but I’d hope our RTM members make the effort to educate themselves on the issues at hand, and follow through with their personal commitments to represent the broader community.
We aim for the platform to capture other facets of our local government over time. Given the recent surge in RTM candidates – with many being incumbents – we hope this data provides discerning voters with some clarity as they head to the ballot box.